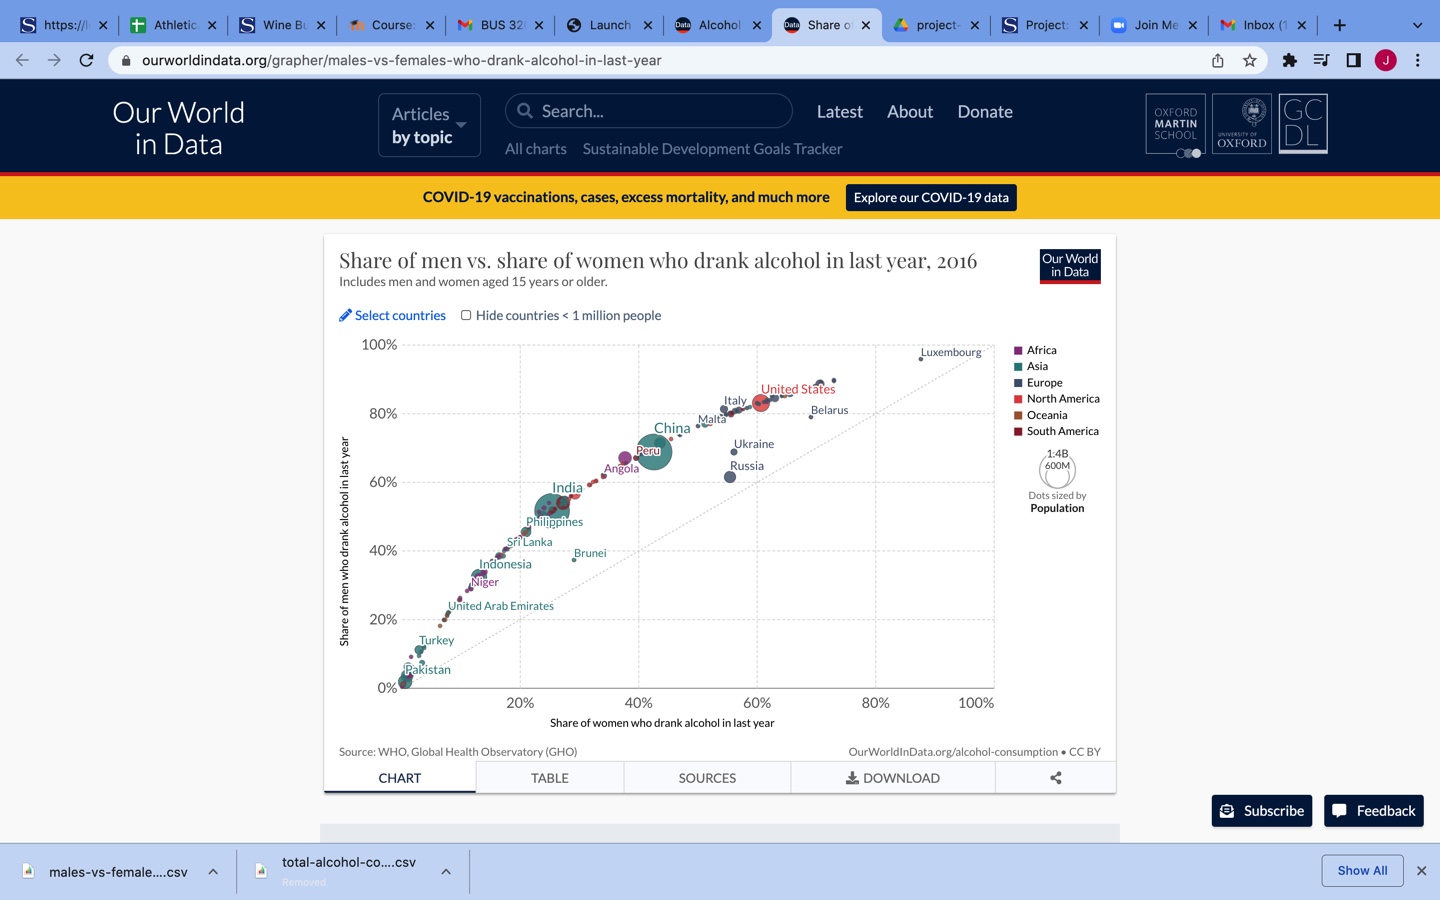
I downloaded Alcohol consumption data from Our World in Data. I selected this data because I am interested in alcohol consumption of men compared to women.
This is the link to the data.
- The following code chunk loads the package I will use to read in and prepare the data for analysis.
- Read the data in
- Use
glimpseto see the names and types of the columns.
glimpse(males_vs_females_who_drank_alcohol_in_last_year)
Rows: 55,705
Columns: 7
$ Entity                                                         <chr> …
$ Code                                                           <chr> …
$ Year                                                           <dbl> …
$ `Indicator:Alcohol, consumers past 12 months (%) - Sex:Male`   <dbl> …
$ `Indicator:Alcohol, consumers past 12 months (%) - Sex:Female` <dbl> …
$ `Population (historical estimates)`                            <dbl> …
$ Continent                                                      <chr> …
# view(males_vs_females_who_drank_alcohol_in_last_year)
- Use output from
glimpse(and View) to prepare the data for analysis
Create the object
countriesthat is a list of countries I want to extractChange the name of the 4th column to Countries and the 5th column to Gender
Use filter to extract the rows that I want to keep: Male, Female and Countries
Select the columns to keep: Male, Female, Countries
Assign the output to
country_alcohol_consumptionDisplay the five rows of data
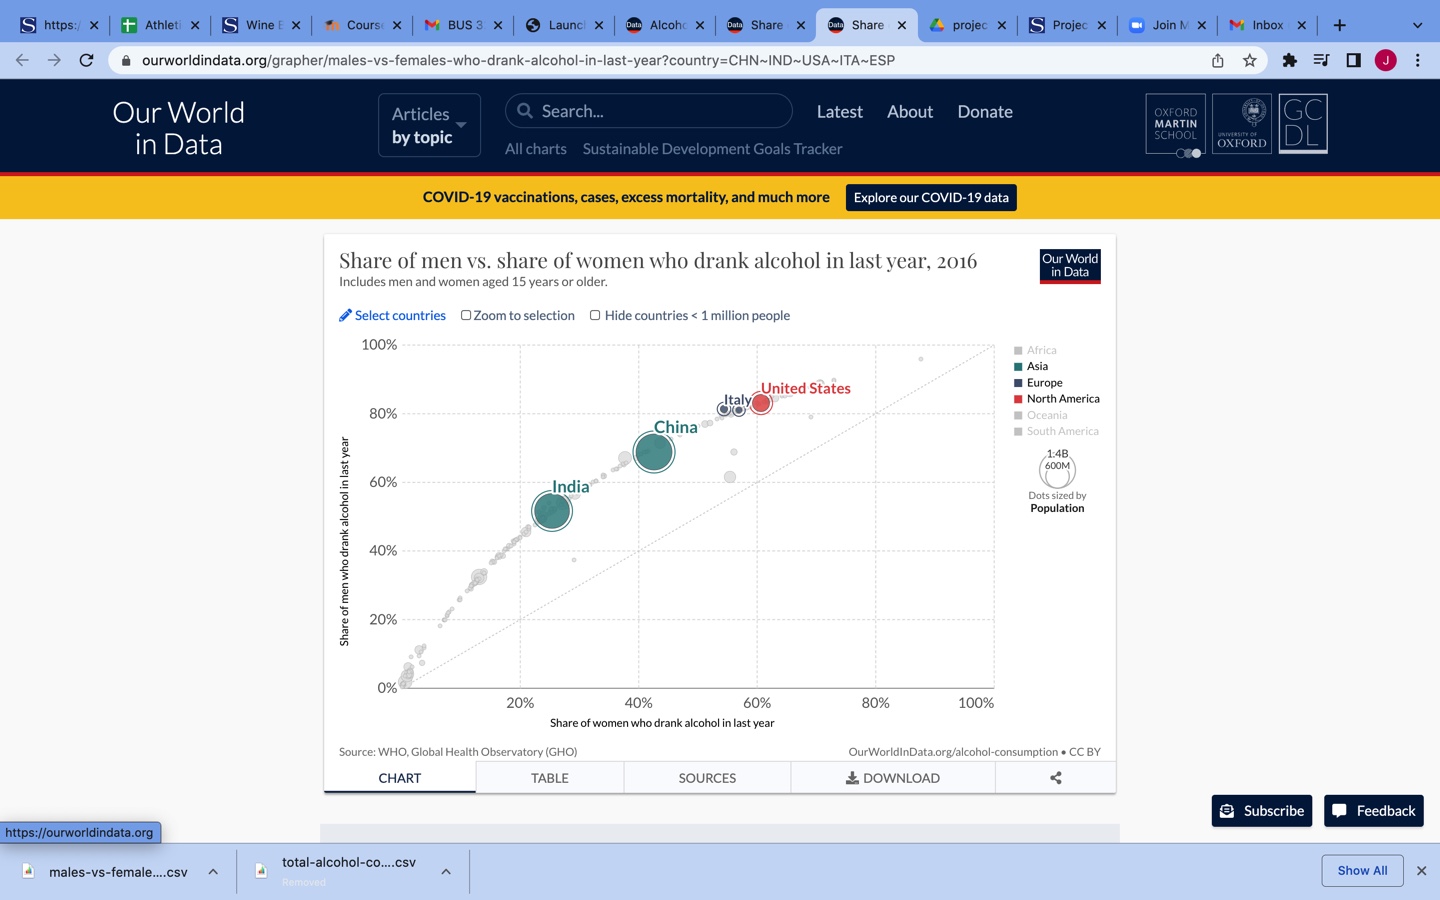
countries  <- c("China",
                "United States",
                "Italy",
                "India",
                "Spain")

country_alcohol_consumption  <-
males_vs_females_who_drank_alcohol_in_last_year %>%
  rename(Country = 1, Male = 4, Female = 5) %>%
  filter(Year == 2016, Country %in% countries) %>%
  select(Country, Male, Female)

country_alcohol_consumption
# A tibble: 5 × 3
  Country        Male Female
  <chr>         <dbl>  <dbl>
1 China          68.6   42.6
2 India          51.4   25.4
3 Italy          81.2   54.4
4 Spain          80.9   57
5 United States  83     60.7
Check that the total for 2016 equals the total in the graph
Write the data to file in the project directory
write_csv(country_alcohol_consumption, file="country_alcohol_consumption.csv")